This article is a summary of the February 2017 Perth Power BI users group meeting presentation I did. We talked about how to develop Time Intelligence models in Power BI. That, said I’m am writing this post as if the reader never attended the session.
The supporting files and Power BI reports are at the bottom of the post.
A quick note about the Perth Power BI User Group
The group meets monthly and is currently hosted by Microsoft Perth. I joined approximately 8 months ago and continue to be impressed by the group. I feel quite honoured that the organiser Bhavik Merchant allowed me to present this month. You can join the group at https://www.meetup.com/en-AU/Perth-Modern-Excel-Power-BI-User-Group/
What is Time Intelligence?
Time intelligence is doing calculations over periods of Time or Dates.
Examples of Time Intelligence:
Aging
Ageing is breaking down calculations over periods of time. My favourite example coming from Operations is the Aged order backlog which shows open customer orders by shipping date or an original acknowledge date.

Other examples include:
- Aged Payables
- Aged Receivables
- Sales by Period
Previous Periods
I’ve also seen this called “Shift Period” Showing the same metric in a previous period (month, quarter, year, etc.)
Comparisons
Comparisons compare two equal periods of time for a given metric. Often these comparisons are expressed as a percentage.
- Year over Year Sales
- On time performance vs. previous month
- Standard hours earned vs. previous quarter
- YOY – Monthly Sales %
Period to Date
Period to date is the aggregation of a metric during a period.
- Revenue Quarter to date
- Inventory Receipts month to date
- Quarter to date Mobile phone costs
Three elements of Time Intelligence
Element 1 – Calendar
I always build a calendar when I’m creating a report in Power BI. It technically isn’t always required anymore as Microsoft will now make a simple Gregorian calendar in the background if you have the feature turned on.
If you have more involved calendars such as a 4 – 4 -5 calendar (4 weeks, 4weeks, 5 weeks) or Australia tax calendar (Year starting July 1) you will need to create one to perform Time Intelligence calculations.
Requirements for a Calendar Table
- One entry/line for every day in the period you want to cover.
- Critical Periods that you want to do measurement against (Month, Quarter, Year)
Below is a snapshot from a 4-4-5 Calendar. If you look at the green line, you can see where the fiscal month changes in a different point than the Gregorian calendar. This example demonstrates the bare minimum for a 4-4-5 calendar.

Methods for building custom calendars
1. Linked tables (NOT RECOMMENDED)
Linked tables are more directed at PowerPivot than with PowerBI Desktop. I don’t recommend this unless you have no better option. The solution is to build the necessary columns in a table in Excel and then link it directly to your data model. Early in my PowerPivot use, I developed some calendars this way. They ended up causing me a lot of pain.
2. Power Query (M-Script) based Calendars
Power Query provides an awesome function called List.Dates which allows you to build calendars out of thin air.
The syntax is List.Dates(start as date, count as number, step as duration) as list
So if we want to create a dynamic calendar that starts on January 1, 2014, that goes until today plus two years in the future we would write:
Source = List.Dates((#date(2014, 1, 1)), Duration.Days(DateTime.Date(DateTime.FixedLocalNow()) – #date(2014,1,1))+730, #duration(1, 0, 0, 0))
You’ll notice that I’ve bolded the 730. This approach is my way of pushing the calendar into the future. Nearly every Power Query calendar you find on the internet ends at Today. If you are using the calendar for business, you are going to want to push this out unless you are certain that your data is only historical.
There is a great post with videos from Ruth at Curbal.com that goes into the creation of calendars in Power Query. https://curbal.com/blog/create-power-bi-custom-calendars
A note on complex calendars like 4-4-5 using PowerQuery
I am personally uncomfortable building a calendar like the 4-4-5 with Power Query. My reason is that Finance departments are notorious for adjusting the last date of the period different than the exact pattern. These anomalies could be managed manually within Power Query but it feels dangerous to me.
Building 4-4-5 calendars in Power Query is dangerous. Make sure you validate!Click To TweetUsing PowerQuery to expand ERP calendars
In many ERP systems, the calendar is one line per period. It will contain the Year, the fiscal period and the start and end date of the period. While you can’t use this directly in your model, you can use Power Query to expand this out to a proper calendar. This approach is an excellent way to ensure one version of the truth.
3. Loading Calendars into a DataBase
When possible having a calendar directly in a database such as SQL Server is my preference. You create one good calendar with all of the detail you require and store it in your database of choice.
Read More: Power BI vs Qlik Sense – the series
Helpful calendar columns for your data model
Here is a small list of useful columns that will make building reports easier:
I call these period flags. They are simply columns that contain a 1 or a 0. For example, Current Month 1 = Yes, this date is in the current month.
- Current Month
- Current Quarter
- Current Year
- Rolling 12 months
A note about Current Date
When building the above columns, you need a reference date for the current date. Whenever possible, I suggest that you don’t use a current date function like Today(). Depending on your situation, I instead suggest using a field in your dataset that tells you the most recent piece of data and use that.
Element 2 – Relate your calendar to your data model
In the below example we’ve linked the Tax calendar to the Backlog table. We do this by dragging the date field from one table to the date field in the Tax Calendar.
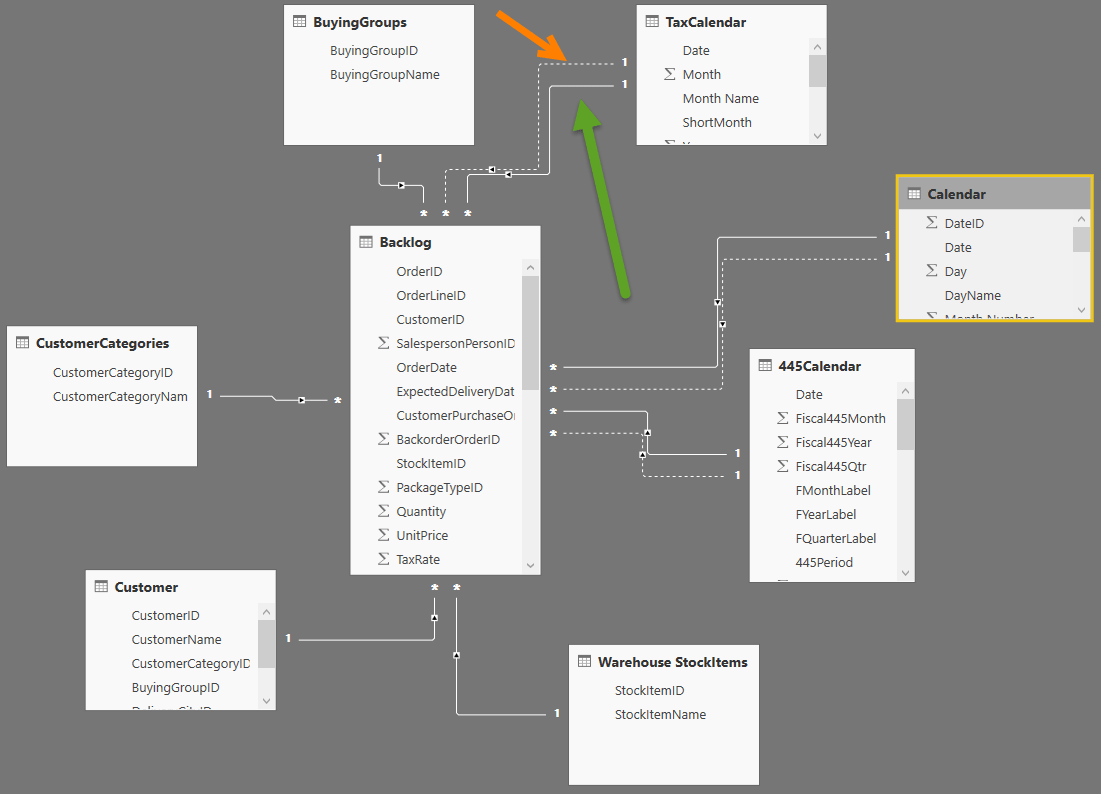
In many cases like the one above, we have multiple date fields in the Fact table (in this case Backlog) that we want to link to our Calendar table. Power BI will only allow you to have one active relationship. In these cases, we create the active relationship, and we also create as many inactive relationships as required. We will then turn on the inactive relationships when we need them in our calculations/ measures.
Element 3 – Measures
In cases where you are just doing Ageing, your standard measures work as is. You will use the axis or column fields in your visuals to create the ageing.
USERELATIONSHIP( ) Function
In the above data model, ExpectedDeliveryDate is the field that has the active relationship (green arrow above) to the Calendar Table. So when we’re calculating the Backlog value we just use a standard formula. In this case, the formula is:
TotBacklog =
CALCULATE ( SUM ( Backlog[ExtPrice] ), Backlog[TestPickNull] = “Y” )
However, when we want to calculate orders based on the same table which would be aged instead by the OrderDate we need to activate the relationship (orange arrow above) to that date:
Orders =
CALCULATE (
SUM ( Backlog[ExtPrice] ),
USERELATIONSHIP ( Backlog[OrderDate], ‘Calendar'[Date] )
)
You will notice above that I’ve used the USERELATIONSHIP function within the orders measure which actives the relationship only while that measure is calculated.
Built-In DAX Time Intelligence functions
Microsoft has provided a whole list of predefined Time Intelligence functions. They work great and can be a real time saver. You can see the complete list here: https://msdn.microsoft.com/en-us/library/ee634763.aspx
Here’s the catch. Built in Time Intelligence calculations only work with standard calendars. Notice what happens below in a 4-4-5 calendar when we try to use the built in TOTALMTD function:

The built-in function fails because it is looking for the pattern of dates in a standard calendar. In this case, the correct MTDOrders445 measure is calculated using the following:
MTDOrders445 =
CALCULATE (
[Orders445Cal],
FILTER (
ALL ( ‘445Calendar’ ),
‘445Calendar'[Yearmonthnumber] = MAX ( ‘445Calendar'[Yearmonthnumber] )
&& ‘445Calendar'[Date] <= MAX ( ‘445Calendar'[Date] )
)
)
The key to this calculation is the All (‘445Calendar’) called out in the Filter function. I demonstrate this further inside the attached Power BI model below.

The best reference available for Time Intelligence formulae that I know is http://www.daxpatterns.com/time-patterns/ This page list out a large number of common calculations and their formulae.
Other tips for Time Intelligence with Power BI
Watch out for time zones
Inconsistent time zones can cause errors in your data. I was recently doing a project where we were pulling data from Microsoft Dynamics CRM. Everything was working great except we had small variances between what Dynamics was calculating and what our Power BI report was producing. The issue ended up being that the tables in Dynamics were in a different time zone and the system was doing the conversion internally.
Time / Data Miss-Matches
If your fact tables have dates that include a time stamp example June 1, 2016, 4:00 PM and you relate this date directly to a field in a calendar table the relationship will not work. The solution is to strip off the time portion and then create the relationship.
The Presentation
A copy of the original presentation is available by clicking the below image.

Here’s the Power BI report that was built for the presentation, it needs to be full screen to be viewed properly. I know you probably came on a mobile device but it’s really worth coming back and viewing it on a tablet or laptop or desktop computer.
Summary: Time Intelligence in Power BI
I highly suggest spending the time to set up your calendar correctly when building your model in Power BI. The time spent up front will save you a great deal of time when creating time and date based measures and visualisations.
I’ll ask one thing only. If you like this share it on a network where you think your connections will get value from it.
Need help with a business intelligence solution. View our BI services or specifically what we do with Power BI.
Leave a Reply