This article talks about an Epicor reports solution using Microsoft Power BI. This approach improves reporting out of Epicor ERP and allows further analysis in MS Excel. We will also provide a short-term solution for long reports that come out of Crystal Reports or SSRS that you may want to review in a more compact form.
All ERP vendors including EPICOR are in an unenviable position when creating standard reports. They are creating reports that need to work for everyone. Let’s be honest all customers are going to want to make adjustments.
Epicor reports out of the box
Out of the box, customers may find Epicor reports (again this is true of all vendors) can be:
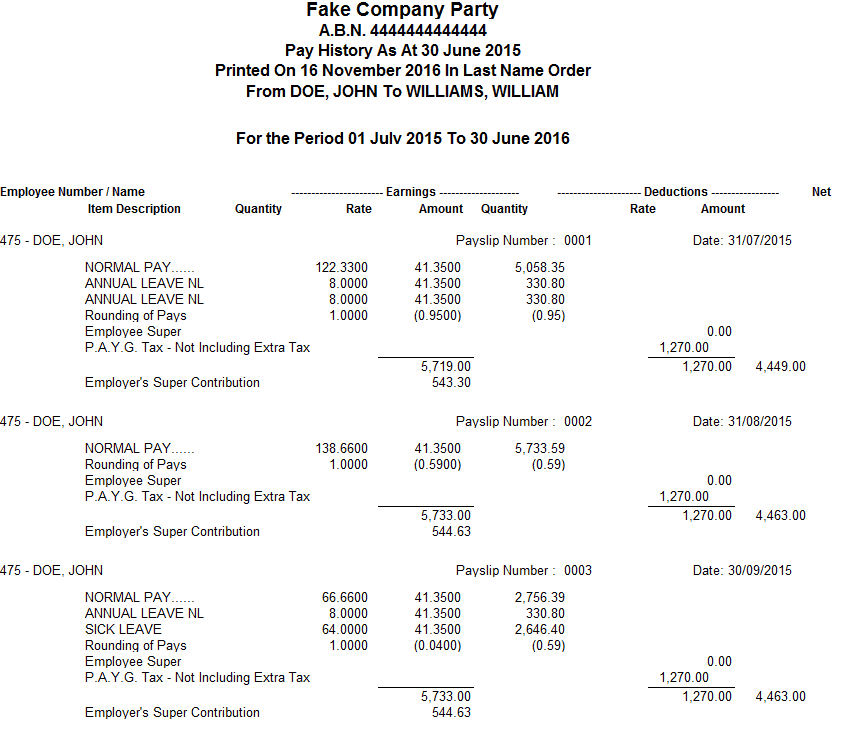
- Long – how about a 100 page Work in process report sorted by production order (job), not aged, with ~4 orders per page. Good for paper companies, bad for Productions Order cost controls.
- Not directly exportable to Excel – When I say this, they do export to excel, and then accounting and operational departments spend hours doing manual ETL work (filter/sort) in Excel so they can begin to do the analysis.
- Incomplete – lacking essential information that users and leaders need
- Calculated differently than you would prefer – I think back to an Excess and Obsolete report I received. It made no sense for our business. In fact, I’m not sure it made sense period, but that’s a different discussion.

What’s great about Epicor for reporting?
Ok, we got the difficulty of standard ERP reports out of the way. Here is the good news:
- Epicor runs on Microsoft SQL Server – this means you can connect virtually any Self-Service Business Intelligence tool to it.
- Epicor have a solution for replicating the production database so that you are not putting the production data at risk. This solution is also nearly real time.
- The data structure is very logical – while there are ~4000 tables they are well labelled and field names mostly make sense.
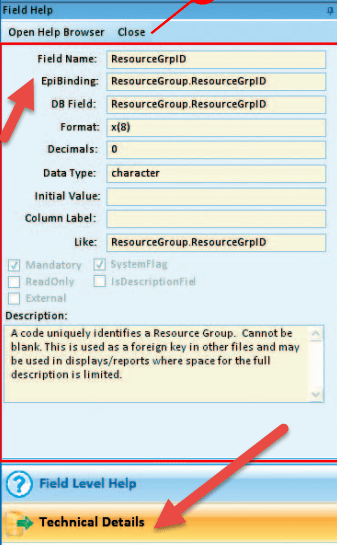
- You can find out the database location of a field using the help menu in any transaction. ** This works 85%+ of the time.
- I’ve yet to find a report I couldn’t build in Power BI (As long as the data is populated in Epicor)
Why not just modify the Crystal or SSRS Reports in Epicor?
If you are in Epicor 10 and you are happy with static printable reports you certainly can. The process is often longer but for those who like this type of report, continue and be happy.
On the other hand, if you are on Epicor 9, building reports in Crystal Reports now may not be the best idea. The upgrade path to Epicor 10 allows Crystal Reports but at a higher licensing cost. If you want to move purely to Microsoft SSRS in Epicor 10, you have to abandon all of the Crystal Reports work.
The PowerBI / SSBI Epicor Reports Solution
The solution from here depends on your skill and what report you want to generate.
Connecting PowerBI / SSBI to Epicor
Your IT department will need to provide read-only access to either the production database or a replication of the database. Some IT folks will feel uncomfortable with this. There are ways to ease these worries. If you find yourself in this situation, drop me a note via email or in the comments.
Once connected to the database, it’s time to start building. Here are some pointers to get you started:
Finding the correct tables and fields
Start in any transaction that you would see the data you want. For example, if you want sales order data, begin in the Order Tracker.
From any transaction:
- Select the field you want with your mouse
- Right click and select help
- When the help dialogue shows up select technical details
- The field DB Field contains the Table Name and Field name separated by a period. **
** There will be cases in which this doesn’t work. These typically occur in calculated fields. In these instances, you will need to figure out the fields that drive the calculation.

Bookings / Customer Orders report
This one is not provided in any form out of the box by Epicor.
The table you want is called BookDtl – It contains all of the transactions related to Sales Orders. Let me clarify this. It is not a list of Sales Orders; it is a list of every single change that occurs to a sales order. That way you can determine what the new bookings are for a given period.
To add detail to the report, you can pull in additional tables such as customer, orderhed and other tables to fill out the level of detail you may want to see.
Reports that involve the General Ledger
Reports such as Work in Progress are generated using run-time instances. You don’t need to know what this is, just that Epicor doesn’t store the calculated data. The secret sauce to creating these reports lies in the combination of the GLJournalDtl table, the TransGLC table and other tables you may be interested in (i.e. Orders, InventoryHistory, etc.)
This method is ideal for creating reports like Aged Work In Progress, Actual Margin Reports, Revenue, etc.
Can I use the Epicor Calendar for time intelligence?
The answer: yes, with effort. Power BI requires a calendar with one entry for every day of the period you want to cover. Epicor by contrast stores the fiscal calendar in a format of one line per fiscal period with the start date and the end date. You can convert this with not too much difficulty using the PowerBI Query Editor.
If you’re not sure what Time Intelligence is and you’d like to learn, we’ve written a long article on how to do Time Intelligence . The article includes sample calculations. Be sure to check it out.
What will the Power BI solution for Epicor look like?
Head over to our sample dashboard to have a play. I suggest reading the short explanation and how-to first.
Hey, Mike, you promised a short term solution?
I did indeed. Nothing drives me crazier than seeing:
- A group of talented individuals who are required to…
- Export long static reports to excel and then…
- Use filters, sorting and delete columns in an hour long process before they…
- Analyse the data, and…
- Do the same thing with the same report several times a month
We’ve all been there.
If you are doing this, you need to turn on the Power Query add-in for Microsoft Excel. Create the transformation once and then just drop the exported file in a folder each time. I show this in some detail in Qlik Sense vs. Power BI – Importing Data. There are a million blogs that already talk about this, if you’re reading this and have one, please add it in the comments.
If you can’t get access to Power Query, you can also do the same transformations in Power BI.
Advantages of this Power BI / SSBI Epicor reporting solution
- It’s interactive. You can drill up and down reports. Click on one element, and all of the visualisations are filtered to provide insights.
- It’s accessible via mobile devices
- You can also do analysis of all of the data in Microsoft Excel (When using PowerBI)
- License costs are low (for PowerBI at least)
- Once you are up and running you don’t need to pay consultants for minor changes (wait why am I telling you this)
What if I want to use Qlik Sense, Qlik View, Microstrategy, Tableau or Domo?
Sure, the same approach applies to each of these tools. PowerBI offers little advantage over the other SSBI tools for this application since the data is normalised and accessible. I also suggest using PowerPivot in Microsoft Excel in certain cases.
Does this work in Vantage?
I believe it does, but I’ve never done it.
What is your approach to reporting in Epicor? What are your biggest problems?

can this tool consume Epicor RESTful web services?
Hi Christian,
The Epicor RESTful web services api is Odata so yes this could be done without issue. Feel free to email me directly on mike@nform.biz and I’ll be happy to help.
Kind regards,
Mike