The ability to relate multiple data tables to each other from various sources makes Qlik Sense and Microsoft PowerBI very compelling. In this article, we are going to review in detail the differences, strengths and weaknesses in building data models in each tool.
This article is part of a series of articles comparing Qlik Sense vs Power BI. You can read the first article here.
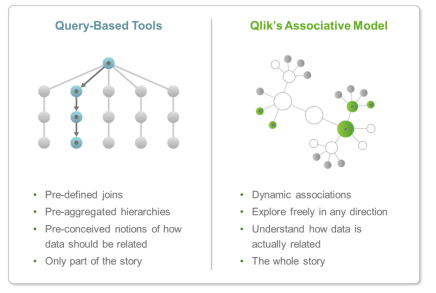
Qlik and Microsoft take very different approaches to data relationships, and in the case of Qlik, their associative model (QIX) is one element they market aggressively as a differentiator.
Microsoft, by contrast, uses a more traditional database model with data in “one to many” relationships. Developers need to be more creative to develop for many to many relationships.
So is the Qlik Associative model much better that what PowerBI offers?
Qlik Sense – The Associative Engine
Here is QlikTech’s marketing description of the Associative Engine:
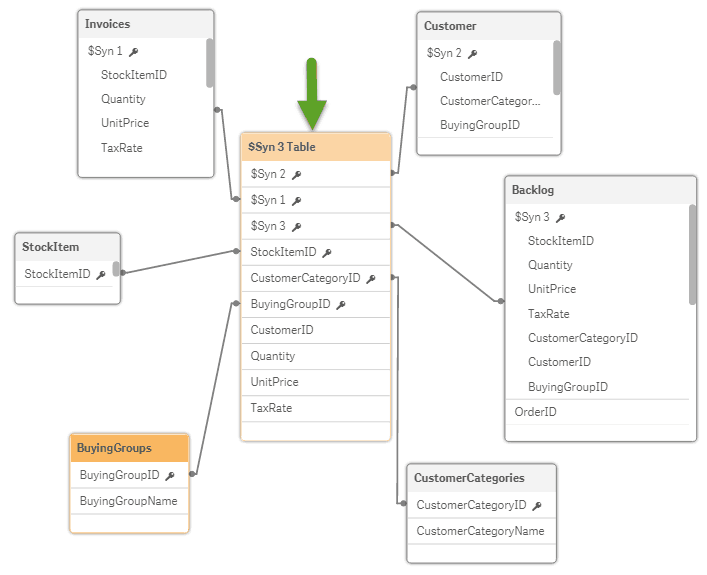
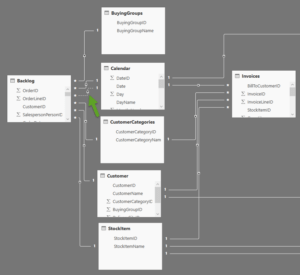
Here is the data model from the World Wide Importers app I created in Qlik Sense:
Qlik Sense QIX Data Model notes:
- All of the relationships were created automatically by Qlik Sense. As you make adjustments by removing or adding tables, Qlik Sense automatically adjusts the data model.
- Under my green arrow, you will notice a synthetic table called $Syn 3 Table. This table was created automatically by Qlik and acts as a central point of the relationships.
- In this model, you do not see a date table. It’s hiding. Qlik Sense created an automatic date table. In this case, I’ve related the key dates to this table through the script. Alternatively, I could have imported a custom date table (nearly always my preference) which would have been visible.
Does the Qlik Sense QIX model work as advertised?
Yes, and very well. I continue to be surprised how the Qlik data model works with little interaction from the user.
Have I been able to trick Qlik Sense to give me bad data?
Yes, through bad technique rather than the tool failing.
What about many to many relationships?
To test “many to many” relationships, I added a simple table called StockItemStockGroup. I also added a table that has the names of the stock groups called stockgroups.
The StockItemStockGroup table looks like this:
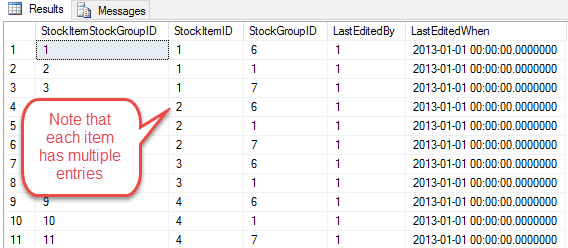
Each stock item, for example, StockItem 1 a “USB Missile Launcher (Green)” is included in multiple groups. The USB missile launcher (which sounds fantastic by the way) is part of the following groups – 6: Computing Novelties, 1: Novelty Items and 7: USB novelties.
The relationship is Many “Sales activities” to One “Stock Item” to Many “Stock Groups” to One “Stock Name” per group.
This relationship is enough to trip up some systems or at least cause the developer to work a little harder. Qlik Sense automatically loaded the tables and created the relationships correctly as per below:
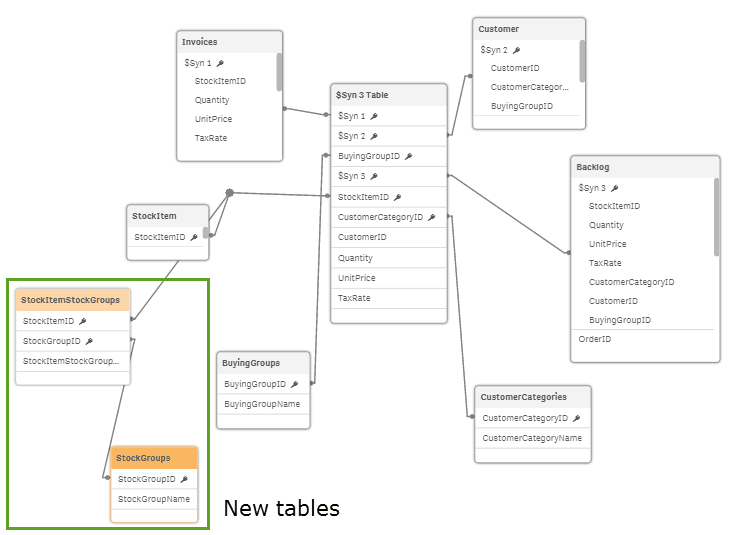
I also tested a pure “many to many” relationship by eliminating the StockItem table. Qlik Sense had no issue with this.
In each case, I tested the data models to ensure they were working. This was done using measures and filters in the Qlik Sense visualisation app and then verified against SQL server.
Microsoft Power BI data model
Early on in the evolution of the Power BI product, (essentially I’m referring to PowerPivot) relationships required manual creation. The relationships were only: single direction and “one to many”. You can read countless blogs across the internet about how to build “many to many” relationships in the models. Better said, how to work around the “one to many” restriction. There will almost always be cases where you have many to many relationships or need filters to flow both directions.
You can read a history of Microsoft Power BI here.
A lot has changed since then. PowerBI desktop now does relationship detection which works rather well. Below is the Power BI version of the same data used in the Qlik Sense test.
Microsoft Power BI data model notes:
- You will notice 1’s and *’s in the relationship as well as an arrow. These arrows refer to the direction of the relationship which flows from the unique item to the table with multiple values.
- Where you see my green arrow, you will notice a relationship with a dotted line. The dotted line represents an inactive relationship. In PowerBI you can only have one active relationship between two tables at any one time. DAX commands are used to activate the inactive relationship when required. This approach may appear to some to be a limitation, but it works quite effectively.
- This model has a calendar table. PowerBI will create “Automatic date tables” if you have a setting turned on. In this case, I’ve imported a custom table which is a personal preference.
Does the automatic relationship detection in Power BI work?
Automatic relationship detection in Power BI is a significant improvement over no detection. The manual interactions still required are:
1) The user/developer must create secondary relationships between tables.
2) You must override relationships when you want cross-filtering to be multi-direction.
Can Microsoft Power BI handle many to many relationships?
Yes and no. Microsoft Power BI can do it. That said, sometimes you need a “workaround” (I’ve heard some call it black magic) to make it work.
In the case above where we brought in the StockItemStockGroup table and the StockGroups table. You end up with the model below:
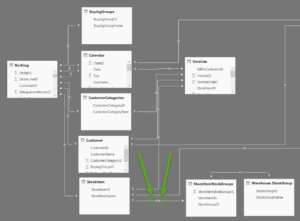
I want to point out the green circle which indicates the multi-directional relationship. As mentioned above the user must set this manually. The model fails if left in the automatic single direction mode.
What happens if a user attempts an actual “many to many” relationship in Power BI?
PowerBI orphans the StockItemStockGroups and StockGroup tables. If I try to rebuild the relationship to the invoice table and the backlog table, I get the following.
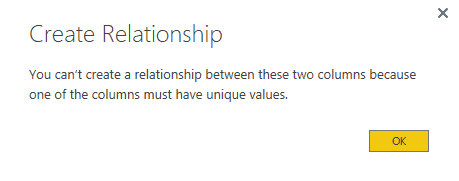
PowerBI will not create direct many to many relationships.
Disaster right? It is more difficult in Power BI than it is in Qlik Sense. The solution is that you put a table with unique values in between the two tables you are trying to join, and the model will work.
Many to many relationships work in Power BI; you just need a little black magicClick To TweetOne small issue with Power BI data models:
This niggle is a pet peeve of mine in Power BI, and so I think it deserves mentioning.
Here’s the situation:
- The user builds a data model.
- The user adds calculated measures and visualisations.
- He/she removes one table.
- Then the user adds the same table back to the data model.
In this case, the measures and visualisations become broken when they are related to the removed table. Even though in the measure the value is the same, it does not recognise the table and fields until you go directly to the measure.
This issue is unique to Power BI. Qlik Sense does not have this issue.
Read More: Qlik Sense vs Power BI – The Series
Qlik Sense vs. Power BI Data Model key differences:
Qlik Sense can handle many to many relationships without intervention from the user.
All table relationships in Qlik Sense are automatic. If you want to add or modify a relationship you need to do so in the script.
There are advance relationships with synthetic tables created in Qlik Sense not seen in a standard database relationship model.
Power BI has a maximum of 1 active relationship per 2 tables.
Many to many relationships are not natively supported by Power BI. That said, many to many relationships can be created using a workaround.
Power BI allows the user to interact graphically with the data model/relationships.
Summary of Qlik Sense vs. Power BI Data Models
Qlik Sense has the advantage regarding the relationships of data tables and creation of data models. Qlik advertises that this allows you to get the entire story vs. a partial story with competitors. The solution they have created is robust. That said, I’ve yet to run into a situation with Microsoft Power BI where I could not create the data model to do the analysis I required.
Need help with Microsoft Power BI or Qlik Sense visit our Business Intelligence services page and then give us a call; we’d love to hear from you!
Part 3 is an entire post on filters. It sounds crazy but we found 8 major differences in how Qlik Sense and Power BI filter data:
Qlik appears to have the edge here. Have you found an application where this “difference” was a big advantage?
Me gusto mucho el articulo, estoy atento a las próximas entregas
Thanks Jonathan!
Disagree. You used a normalized set of data to start with. In the real world, data is not perfect. QLIK requires unique field names. In my experience, creating data sets in QLIK via scripting is left up to highly experienced data architects. In real world cases, it is rendered useless to much of the company, because of IT constraints.
Jeff, I agree with your comments about the scripting in Qlik and felt I dealt with them in the importing data article here. It is true that many will struggle pulling data into Qlik and that the Power Query functionality in Power BI aides this greatly. That said this article was intended to focus purely on the data model. It’s my opinion that Qlik has an advantage here. The size of the advantage is debatable and I’m hoping others will chime in.
Your point is well taken Mike. I guess from my standpoint, data modeling needs to be flexible, as we add information into our work. QLIK, in my opinion, is too rigid because it requires unique names. Internally it makes 1 big table, which is not flexible. Just my 2 cents. Keep up the great work!
Cheers Jeff!
Totally agree with Jeff, automatic relationship is a bug not a feature, I work mainly with PowerBI but i tried to learn Qlik as a potential free BI solution ( long story)
it is really rigid, you need to rename all the fields, and when you have multiple facts tables you need to concatenate them all, otherwise you end up with a weird non functioning model.
having said that, once the model is in place, Qlik filtering and Bookmarks features are gold, I hope they works more on the data preparation side.
Hmmm…I’ve never heard the automatic relationship in Qlik called a bug. It’s a completely different (and sometimes mind bending way) to build data models.
Mike
not really a bug :), i meant it is inconvenient,
I come from an Excel background, when I try to prototype a solution, I just load a bunch of tables and then try to figure out the best way to link them, and i keep changing until something that make sense
Qlik is different , it is more formal, you need to know what you are doing before loading anything, there is nothing wrong with that, it is just i find PowerBi more flexible.
I’d be interested to see what Qlik does with a more complex model with say 30 tables and 5 different M2M relationships.
With Power BI having to set bidirectional manually isn’t always the case. While it is extra work, I like being able to control which filter paths are allowed as automatic M2M in all directions doesn’t always make sense from the analysis perspective.
Talk more next week!
Hey Bhavik,
Thanks for the comment. I’m interested to know what the case is where an automatic bi-drectional relationship is set up. I mention the manual set but I consider this a benefit.
There probably needs to be another section in the article that talks about the stark differences in the approaches to data modeling. In Qlik for example modelers are encouraged to concatenate fact tables and create wide tables which often contain dimensions. While as in MS Tabular (Power BI) models the message is long and narrow with dimension tables.
Regards,
Mike
Interesting.. i’m not a fan of large flattened tables. They quickly become unusable as you add more business entities to your model. There are also situations where this simply cant work.. many M2M scenarios for example – requiring you to force down granularity of measures if you try to incorporate into one table. Conversely, dimensional models can get big and messy but there is good guidance from the Kimball group on that. Im sure this is all old news to you anyway 🙂
I havent come across long and narrow dimension” as a suggested best practice for Power BI. For me the rules are to only incorporate attributes that are actually meaningful for analysis, and avoid large text columns and anything else with high cardinality as they are not very compressible. Since the engine is a columnstore the width of the dimension doesnt make a big difference.
With bidirectional relationships to be honest i havent noticed in exactly what scenarios these are created automatically. Im just so used to reviewing and purposefully setting them that i havent given it much thought!
Bhavik….not “Long narrow dimension”….I should have written it better….Narrow fact tables with separate dimension tables. Your statement says it better yet. 🙂
Mike, just a housekeeping note; unless I’m doing something wrong, the link in this blog to Part 3: Filters currently leads back to Part 1: Importing Data.
Patrick, THANK YOU!!! Fixed now.