 Delivery on-time performance is arguably the most fudged metric/KPI in manufacturing, distribution and service businesses around the world.
This article is an effort to lay out the pitfalls and describe solutions for how to get OTP right. My ultimate goal is to provide the tools to be able to create consistent, measurable On-time performance metrics. Let’s get started.
Why is Delivery On-Time Performance so often wrong?
Four fundamental reasons driving inconsistent and incorrect shipment performance metrics.
Inconsistency in systems

In multinational organisations, it is common to have multiple Enterprise Resource Planning (ERP) systems and business intelligence systems. In some cases the system may be no system at all and employees are manually generating figures on paper or in a spreadsheet. Some ERP systems will have built-in OTP calculations while some will not.
Inconsistency in method of calculation
Let’s give 20 Manufacturing Plants an instruction to measure On-Time Performance and provide no guidance on how to do so. I will bet that you will get a minimum of 10 different calculation methods.
Incentives for inflated values

It’s a bit of the elephant in the room and I feel the need to call it out. Plant Managers, Operations Managers, Director of Operations and others are very likely to have incentive plans that include On-Time Performance. In many cases, it’s a significant percentage of the incentive. The values are rarely audited.
Competing priorities between finance and operations
Shipment dates also drive financial metrics such order backlog measurements. In cases where an ERP system doesn’t have multiple dates for order management, it is common to see a finance team move orders so that the aged order backlog shows correctly. It’s a no-win situation, and both sides have strong positions.
Five Methods for calculating delivery on-time performance
The following five methods have one thing in common. They all require that you determine a Yes or No value for whether the order is on time or not. This is 1 = On-Time 0= Late. We will refer to this as the on-time flag or OTF. The difference is the level of granularity.
Below is a table of fictional data from the “We ship 99% on time” company. Notice how as we change the metric the value swings wildly.
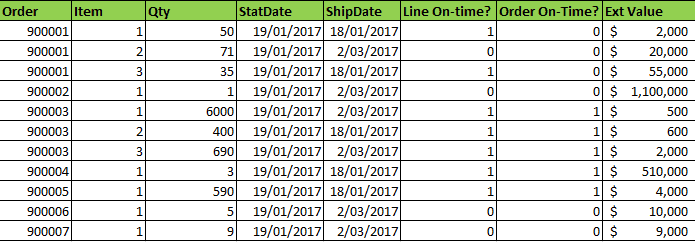
On-time performance by value
Typically measured at the line item level. This is calculated as: OTP Value:= (Item extended value x OTF) / (Sum of Extended Values)
Value = 34%
On-time performance by line item
OTP by Item: = Sum of Item OTF / Number of Lines
Value=64%
On-time performance by Quantity
OTP by quantity:= (Item Quantity * Item OTF) / (Sum of item quantities)
Value = 99%
On-time performance by Order
OTP by Order:= Order OTF/Number of Orders
Value = 43%
On-time performance composites metrics
Composite OTP metrics bring together two or more metrics into one. Typically I see this done with OTP by Item and OTP by value. So the equation is (OTP by Item + OTP by Value)/2
Value=49% (Using a composite made up of OTP by Item and OTP by Value
Comments on the above metrics
You can quickly see from the above example that there is caution required in selecting the correct metric for your business.
In the case of quantity, the on-time performance metric is nearly 100%. However, your customer that drove the largest share of revenue is severely unhappy and finds it strange when he/she sees 100% OTP posted proudly on your shop floor.
The same metric however in a high volume low mix environment may work excellent.
Supporting metrics

Average days past due
Average days past due is calculated as worded. You take the average number of calendar days (some use working days) and divide it by the number of lines or orders.
Average days past due works well in facilities where the on-time performance is poor. It becomes a poor metric when the on-time performance of the business improves as it can begin to drive bad behaviour. In this example, if you have only one order which is three weeks late and the target is one week. It is not uncommon to see two or three orders shipped one day late to bring this metric on target.
On-time performance + 1
OTP+1 is a metric intended to look at what would be the On-time performance if you had an extra week. It’s a comparison metric and can be useful to give you an additional check to see whether you need small changes or a step change.
Vendor on-time performance
Vendor on-time performance is an excellent leading indicator of facility shipment on-time performance. If vendor on-time performance is poor and OTP is above target, there is an excellent chance that the metric is being “gamed”.
Lead time
The measurement of how long it takes from order receipt to order shipment.
Number of ship date changes
Some businesses will implement a counter field on the statistical delivery date. Counters are intended to be an indicator of how often dates change on a single item. The effectiveness of this is debatable, but I thought it was worth mentioning.
System considerations
System dates
It’s important that you have multiple dates in you business system to cover the reporting requirements of the business and the customer. These dates include:
- Statistical Shipment date: The date you promised client you would ship
- The current ship date: The current scheduled date, which will also drive order backlog planning
- The required date at the customer: If there is a large shipping time, it’s best you capture this
Allowable changes
Businesses employ a range of administrative rules or policies to attempt to kerb the misrepresentation of OTP metrics. A common one is, no changing the statistical date without a letter from the customer or updated purchase order.
No changes without the client’s sign-off is a tough one. What do you do when you are ready to ship, and the customer decides not to pick up. Are you going to take the hit? I suggest the answer should be no.
Suggestions
Here’s my list of suggestions to get on-time performance right
- Once the system records an item as late, don’t allow changes. As soon as you allow changes, the urgency to record details correctly drops.
- Make sure everyone in the operational chain understands how On-time Performance is calculated.
- If you can, systemize the calculation. I recommend self-service business intelligence tool like Power BI and Qlik Sense. Avoid manual calculations whenever possible. Many ERP systems will also do the calculation for you. If you are going this route, make sure you agree with how the ERP system is doing the calculation.
- Make results visible. Everyone in a facility should know what the current OTP rates are.
- Pick incentives that drive the right behaviour. The best OTP incentive I was on as a Plant Manager was new order achievement.
Have you got a different solution for OTP? Let’s hear it.
Hi, my plant has a weird way of handling overdue order. Take for example, lines that were there supposed to deliver in Feb was late. it got delivered eventually in Jun. Should this late line appear in Feb, Mar, Apr, Jun report or just Feb report?
My thoughts is it should only appear in Feb report but there should be a supporting metrics like Aged Order Report to show number of lines overdue and its aged.
Would appreciate if you could share your thoughts on this scenario.
Hi Derek,
In my opinion this should be shown in the Jun report for the reason that it reflects when the shipment was made.
Mike