What is Power BI in 2017? We will go through a history back to Excel 2010 and go through the use of each component. Near the end of the article, we’ve added a FREE pdf which lays out the components and interactions.
 When I started working with Power Pivot in Microsoft Excel years ago, I kept hearing about PowerBI. At the time there was not a single product on the market that I could find that carried the brand Power BI. That’s changed now, but the confusion still exists so let’s break it down.
The Microsoft Power BI toolbox
Power BI is a tool box with spectacular tools for data analytics. You put raw data in, you get insights, charts, KPI’s out – instantly.
What’s in the Power BI toolbox – A brief history
Power BI started as add-ins in Excel 2010 they were:
Power Pivot for Microsoft Excel
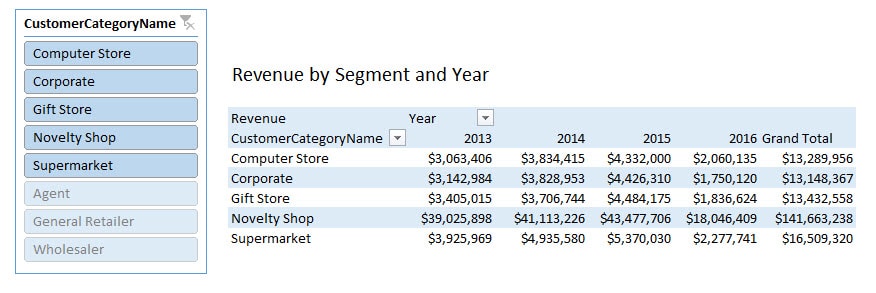
A revelation when it first came out. For the first time, users could take millions of rows of data, from multiple sources and analyse them right in excel.
Power Query for Microsoft Excel
While Power Pivot does the calculation, Power Query does the shaping. You use power query to take data that needs to be “cleansed” before you can use it. The real strength for most users is that you don’t need to learn code to modify the data. We’ve shown two samples of ribbons from power query below which allow you to shape your data with simple mouse clicks. I should mention that if you are looking for PowerQuery in Excel 2016, it is called “Get and Transform” to confuse us further.


Example of Power Query Data Shaping
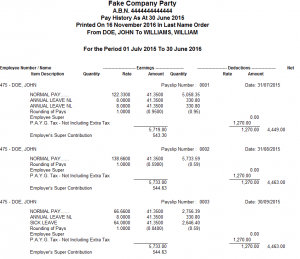
Below is an excellent example of a data cleansing situation that users find themselves in regularly. Our fake payroll report if you export it to Excel is nearly unusable. The table below is the results of 15 minutes with PowerQuery. The other beauty is your can reuse the work you did over and over as you receive the same report.

Microsoft Sharepoint PowerPivot Galleries
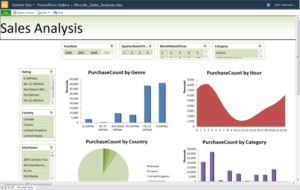
The SharePoint PowerPivot Gallery was the original method for sharing your Power Pivot workbooks in larger organisations. Of course, you could always just share the file, but this was the corporate IT solution to do it without the problems of multiple files.
With the introduction of Excel 2013 we got the following new tools:
Power View for Microsoft Excel
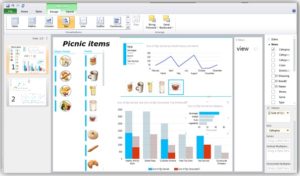
Power View introduced the interactive dashboard to Excel. You can click on one element of a chart, filtering the other charts by that selected field. It isn’t pretty, but it works, and it’s inside Excel.
Power Maps for Microsoft Excel
Power Maps brought geographical analysis to the party. Now you can take that data model you built in Power Pivot and analyse it on maps.

Ok, so now we’re at the release of Microsoft Excel 2013. The words Power BI are still not seen on the product. The real issue though was that as powerful as these individual tools were, the integration was poor. Let me also say, they were and still are mind-bogglingly powerful. Strong Excel users were producing Business Intelligence solutions that were significantly more insightful than Big data warehouse solutions that took 12 months to develop, frustrated users and often didn’t work.
There was a serious shortcoming with the Power BI toolbox: Sharing
As of Excel 2013, there was no good method to share your reports or dashboards with colleagues. Microsoft had attempted the SharePoint gallery method, but it is a struggle to get IT departments to implement, has limitations, and it just isn’t very good. Sharing files was the solution for many. I should note that there are times when I still suggest sharing files. GASP!
July 2015: Power BI Desktop and the Power BI service are born
2015 brought two new major tools to the Power BI toolbox
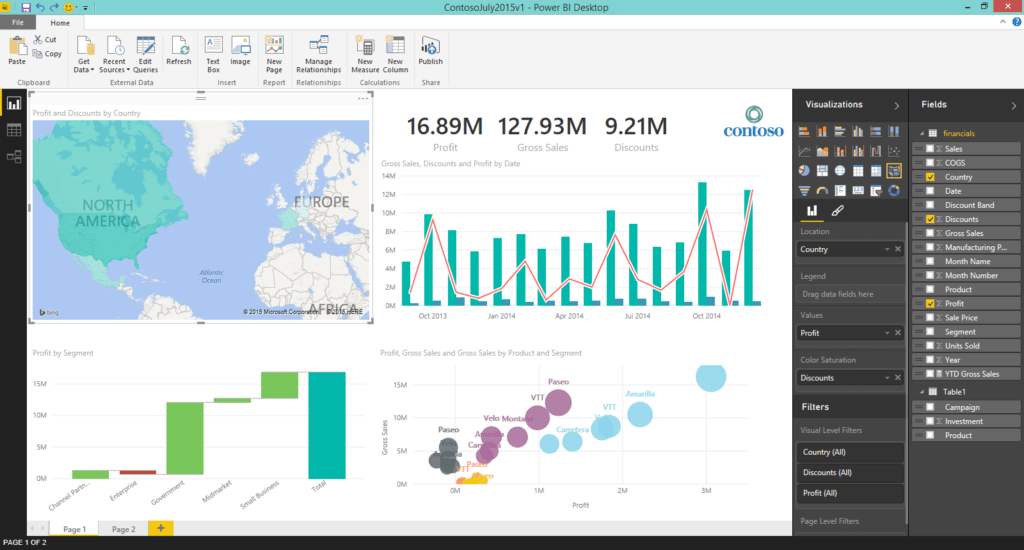
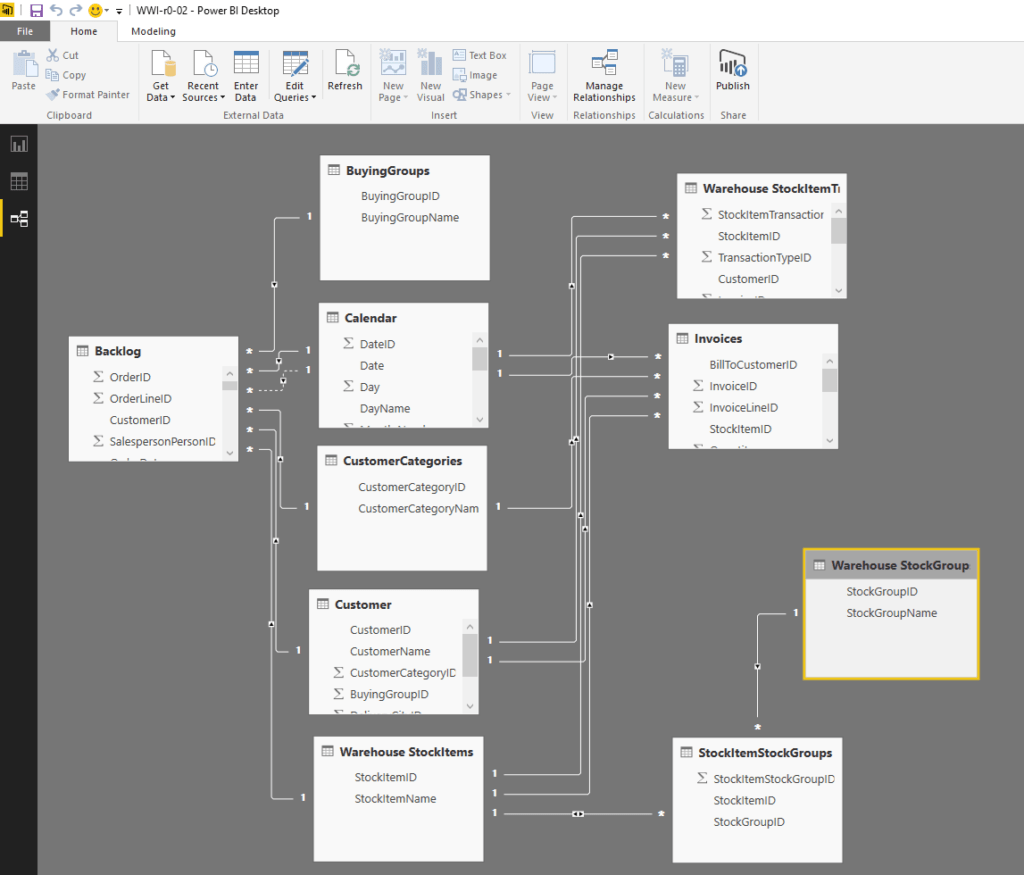
Power BI Desktop
A software package, free to download and use, that combined Power Pivot, Power Maps Power View and Power Query into a stand-alone tool completely separate from Microsoft Excel. Power BI desktop is intended to be the design centre where you create your dashboards.
PowerBI.com Service
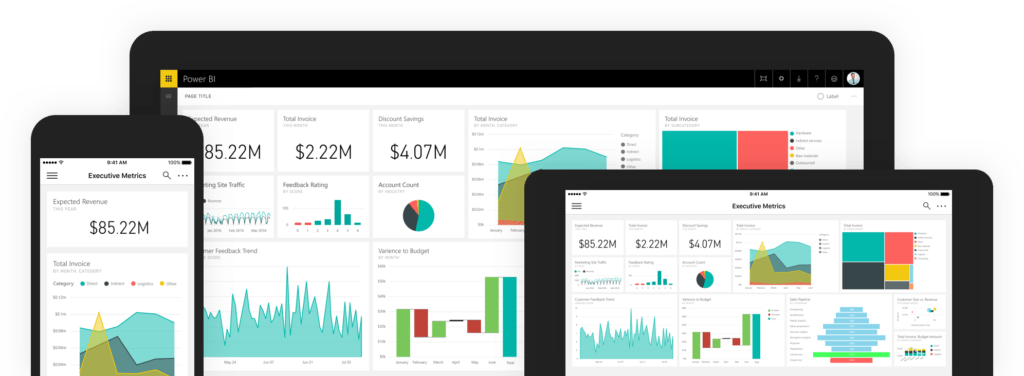
An online cloud service that allows users to build and share dashboards and reports with other users. It even allows you to create a dashboard and share it on your website.
Power BI Apps
An extension to the PowerBI.com service, Microsoft introduced applications for Android, iOS, and Windows Phone (is that still a thing?)
Late 2015 Power BI data Gateways are released
Microsoft needed a way to get data that was on PC’s and Servers to the Power BI services. The data also needed to refresh regularly. This brought the following two tools:
Power BI Personal Gateway – Free to download and use, the Personal BI Gateway allows one user to upload their data to the Service and have it refreshed regularly.
Power BI Enterprise Gateway – The Enterprise Gateway allows organisations to upload their data to the Power BI service on a regular schedule. It also allows “direct query”. Direct Query is for companies that do not want their data in the cloud but want to see and share their dashboards online.
So as of 2017, what is Power BI?
Here’s a FREE PDF that shows the entire Power BI toolbox as it stands in 2017 as well as the data flows:
Here is our simple answer:
Power BI is a group of ~7 software tools to help you import, shape, aggregate, visualise and share data.
What about the competition. You can read our VERY detailed comparison vs. Qlik Sense which starts here. You can also see our BI Services based out of Perth, Australia here.
We ask of you only two things: If you liked this post share it and tell us why in the comments. If you don’t like it, let us know why in the comments.
Leave a Reply